In 2012, the social gaming market in the United States had 80 million active users, according to eMarketer data. A Nielsen study published in April 2012 showed that 14% of people bought a product after seeing it promoted on a social network, 26% engaged with the ad, and 15% shared it. For brands looking for engagement mechanisms beyond passive advertising, social games were a real and underexplored lever.
It was in this context that Ubbin Labs started the Gamefoundry project, in co-promotion with Fraunhofer Portugal AICOS, co-funded by QREN and FEDER with an estimated investment of 378,000 euros. The objective was to build infrastructure for digital marketing through social games, including collective behaviour analysis and user profiling based on real interaction data.
The architecture
The system had three main modules.
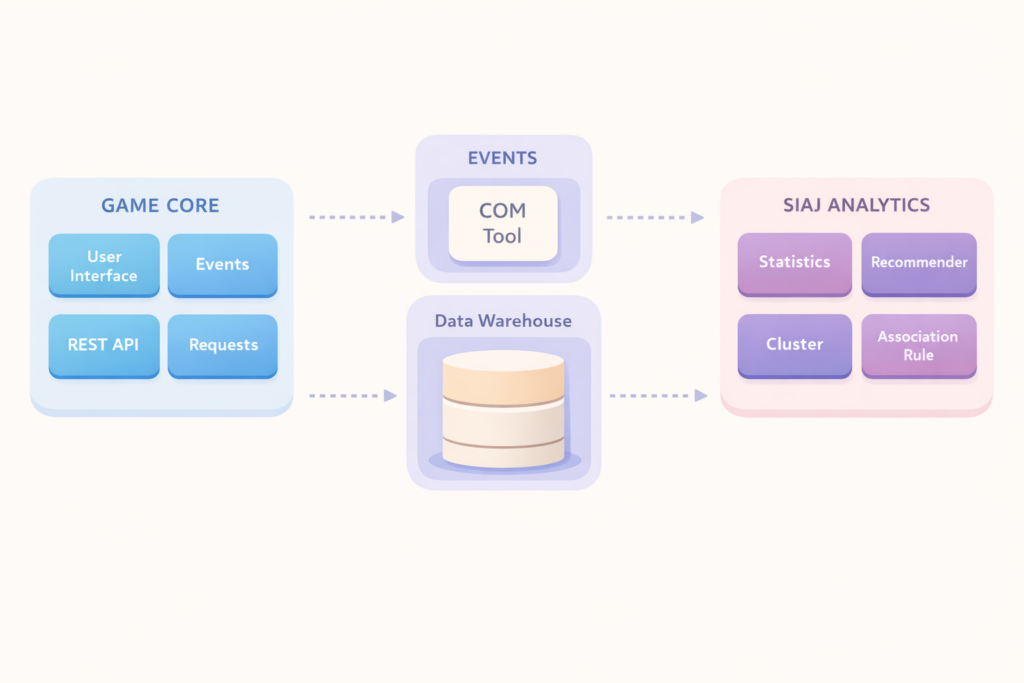
GameCore was the central hub: it managed data for clients (publishers), players, and games, and provided two web portals. The publisher portal allowed creating, customising, publishing, and managing games, and accessing statistics and data mining results. The player portal let users explore available games, play, access their profile, and view leaderboards. Games were built in HTML5, CSS3, and JavaScript, structured in three segments: Option Selection (optional), Target Questions (optional but critical for data mining), and the game itself. The GameCore API was REST-based, with JSON responses and JSONP support for cross-domain use.
The Social Game Containers were the distribution layer, available for web, Facebook, and mobile (Android and iOS). Each container handled player authentication via Facebook or Google OAuth, loaded games, and sent interaction data to the analytics module. Data collected included player location (country, city, GPS coordinates), device information (brand, model, operating system), session duration, events with timestamps, and score. Web and Facebook containers were publicly released at the time of the paper’s publication; mobile containers were in development.
The GDSS (Game Data and Support Service), called SIAJ in the early stages of the project, was the processing and analytics module. It had three sub-modules: communication with GameCore and Containers, statistical analysis and data mining, and database. Communication between the messaging and analytics components ran through a message queue implemented with Apache ActiveMQ. Processing was triggered when matches waiting for analysis exceeded 5% of the total, avoiding on-demand processing that would have degraded performance. Data was stored in MongoDB, chosen for document model flexibility and the expected scale of the data stream. The analytics component used stream mining techniques to update results iteratively rather than recalculating from scratch each cycle.
Security was handled by AuditMark, internationally recognised for the JScrambler JavaScript protection technology, used at the time by companies including RSA Security and Rovio. AuditMark contributed source code protection for the JavaScript modules, security control design for collected data, and fraud detection techniques for ad traffic auditing.
Stream mining in practice
The analytics pipeline ran three types of algorithms over player interaction data.
Clustering with K-Means: automatically grouped users by similarity across demographic, geographic, and game behaviour data. Each cluster produced a typical user profile available to the publisher.
Classification with Decision Trees (C&RT): identified the distinguishing features between user profiles for each answer in the Target Questions. On a small sample, the classifier did not produce robust results, a fact documented in the paper as a consequence of sample size.
Association Rules with FP-Growth: identified associative patterns between answers and behaviours. Results were validated with Rapid Miner.
What the data showed
The 18 contests published on Palco Principal during the tests involved more than 2,300 distinct users, all in quiz format, with prizes of event tickets. In one specific contest with 524 participants and two Target Questions, the association rules results were as follows:
| Premise | Conclusion | Support | Confidence |
|---|---|---|---|
| Optimus Alive | Spotify | 0.195 | 0.538 |
| Coldplay | Spotify | 0.170 | 0.495 |
| Muse | Spotify | 0.183 | 0.469 |
| The Simpsons | Spotify | 0.178 | 0.455 |
| 5 para a meia noite | Spotify | 0.198 | 0.454 |
The most cited rule: 54% of players who had liked Optimus Alive on Facebook used Spotify to listen to music online. For a music festival’s marketing campaign, knowing that more than half of the Facebook audience uses Spotify is information with direct value in media buying decisions. The paper published in Procedia in 2014, at the 2nd International Conference on Strategic Innovative Marketing, documents the methodology and full results.
What it became
Gamefoundry was R&D. What followed was product. GameCore, the gamification mechanisms, the behavioural analytics infrastructure, the multi-platform container distribution model: these elements moved from the research project into the foundation of GFoundry. The multi-container architecture that today allows enterprise clients to manage multiple subsidiaries with independent branding on a single system has direct origin in the Game Containers model developed in Gamefoundry.